Learn my secrets to creating a successful online business with my holistic strategies and soulful marketing advice for heart-centered entrepreneurs who value relationships, mindfulness, spirituality and health as much as strategic action and practical tips.
LEARN MORE →


Success with Soul Incubator
Success with Soul Shop
Launch Your Dream Offer Mini Course

Our most popular posts to help you create, grow and monetize your online business with soul!
EXPLORE POSTS →
Income Reports
Passive Income
Increasing Traffic


The Business Metrics I Track Weekly + What I Ignore
March 27, 2026
Kate Kordsmeier


")

Last Updated on March 27, 2026
Here are the exact weekly business metrics I track as a CEO — net revenue, profit margin, and email growth — plus the vanity metrics I’ve permanently deleted from my dashboard (and my mental real estate).
For the first two years of my business, I checked my Instagram follower count more often than I checked my bank account.
I’m not proud of it. But I’m also not surprised — because the entire online business industrial complex had me convinced that followers were the thing. More followers = more visibility = more sales. The math felt airtight. Except it wasn’t, and my bank account at the time had the receipts.
Here’s what I’ve learned since then: the business metrics that feel satisfying to track are almost never the ones that matter. Follower counts, pageviews, open rates, launch buzz… these are designed to give you a hit of dopamine, not a profitable business.
The business metrics worth tracking weekly are net revenue, profit margin, email list net growth rate, and conversion rate on your primary offer. Everything else — social media following, raw traffic numbers, hours worked — is noise dressed up as data. When you measure the right five numbers, you stop optimizing for busyness and start running an actual business.
This post breaks down exactly what’s on my weekly CEO dashboard, why I chose each one, and the metrics I’ve officially retired — including a few that might surprise you.
Table of Contents
Why Most Entrepreneurs Are Measuring the Wrong Business Metrics
Most online entrepreneurs track what’s easy to see, not what actually predicts profit. Social platforms put your follower count at the top of every screen. Your email tool shows you open rates on the dashboard homepage. Website analytics greet you with total pageviews. These numbers are designed to be visible but that doesn’t mean they’re meaningful.
The real cost of misaligned metrics is this: you optimize for whatever you measure.
If you’re measuring likes, you’ll unconsciously start chasing content that generates likes. If you’re measuring pageviews, you’ll write for traffic instead of conversion. The metrics you track shape the decisions you make, which shapes the business you build.
I call this the vanity metric trap… and I lived in it for longer than I’d like to admit.
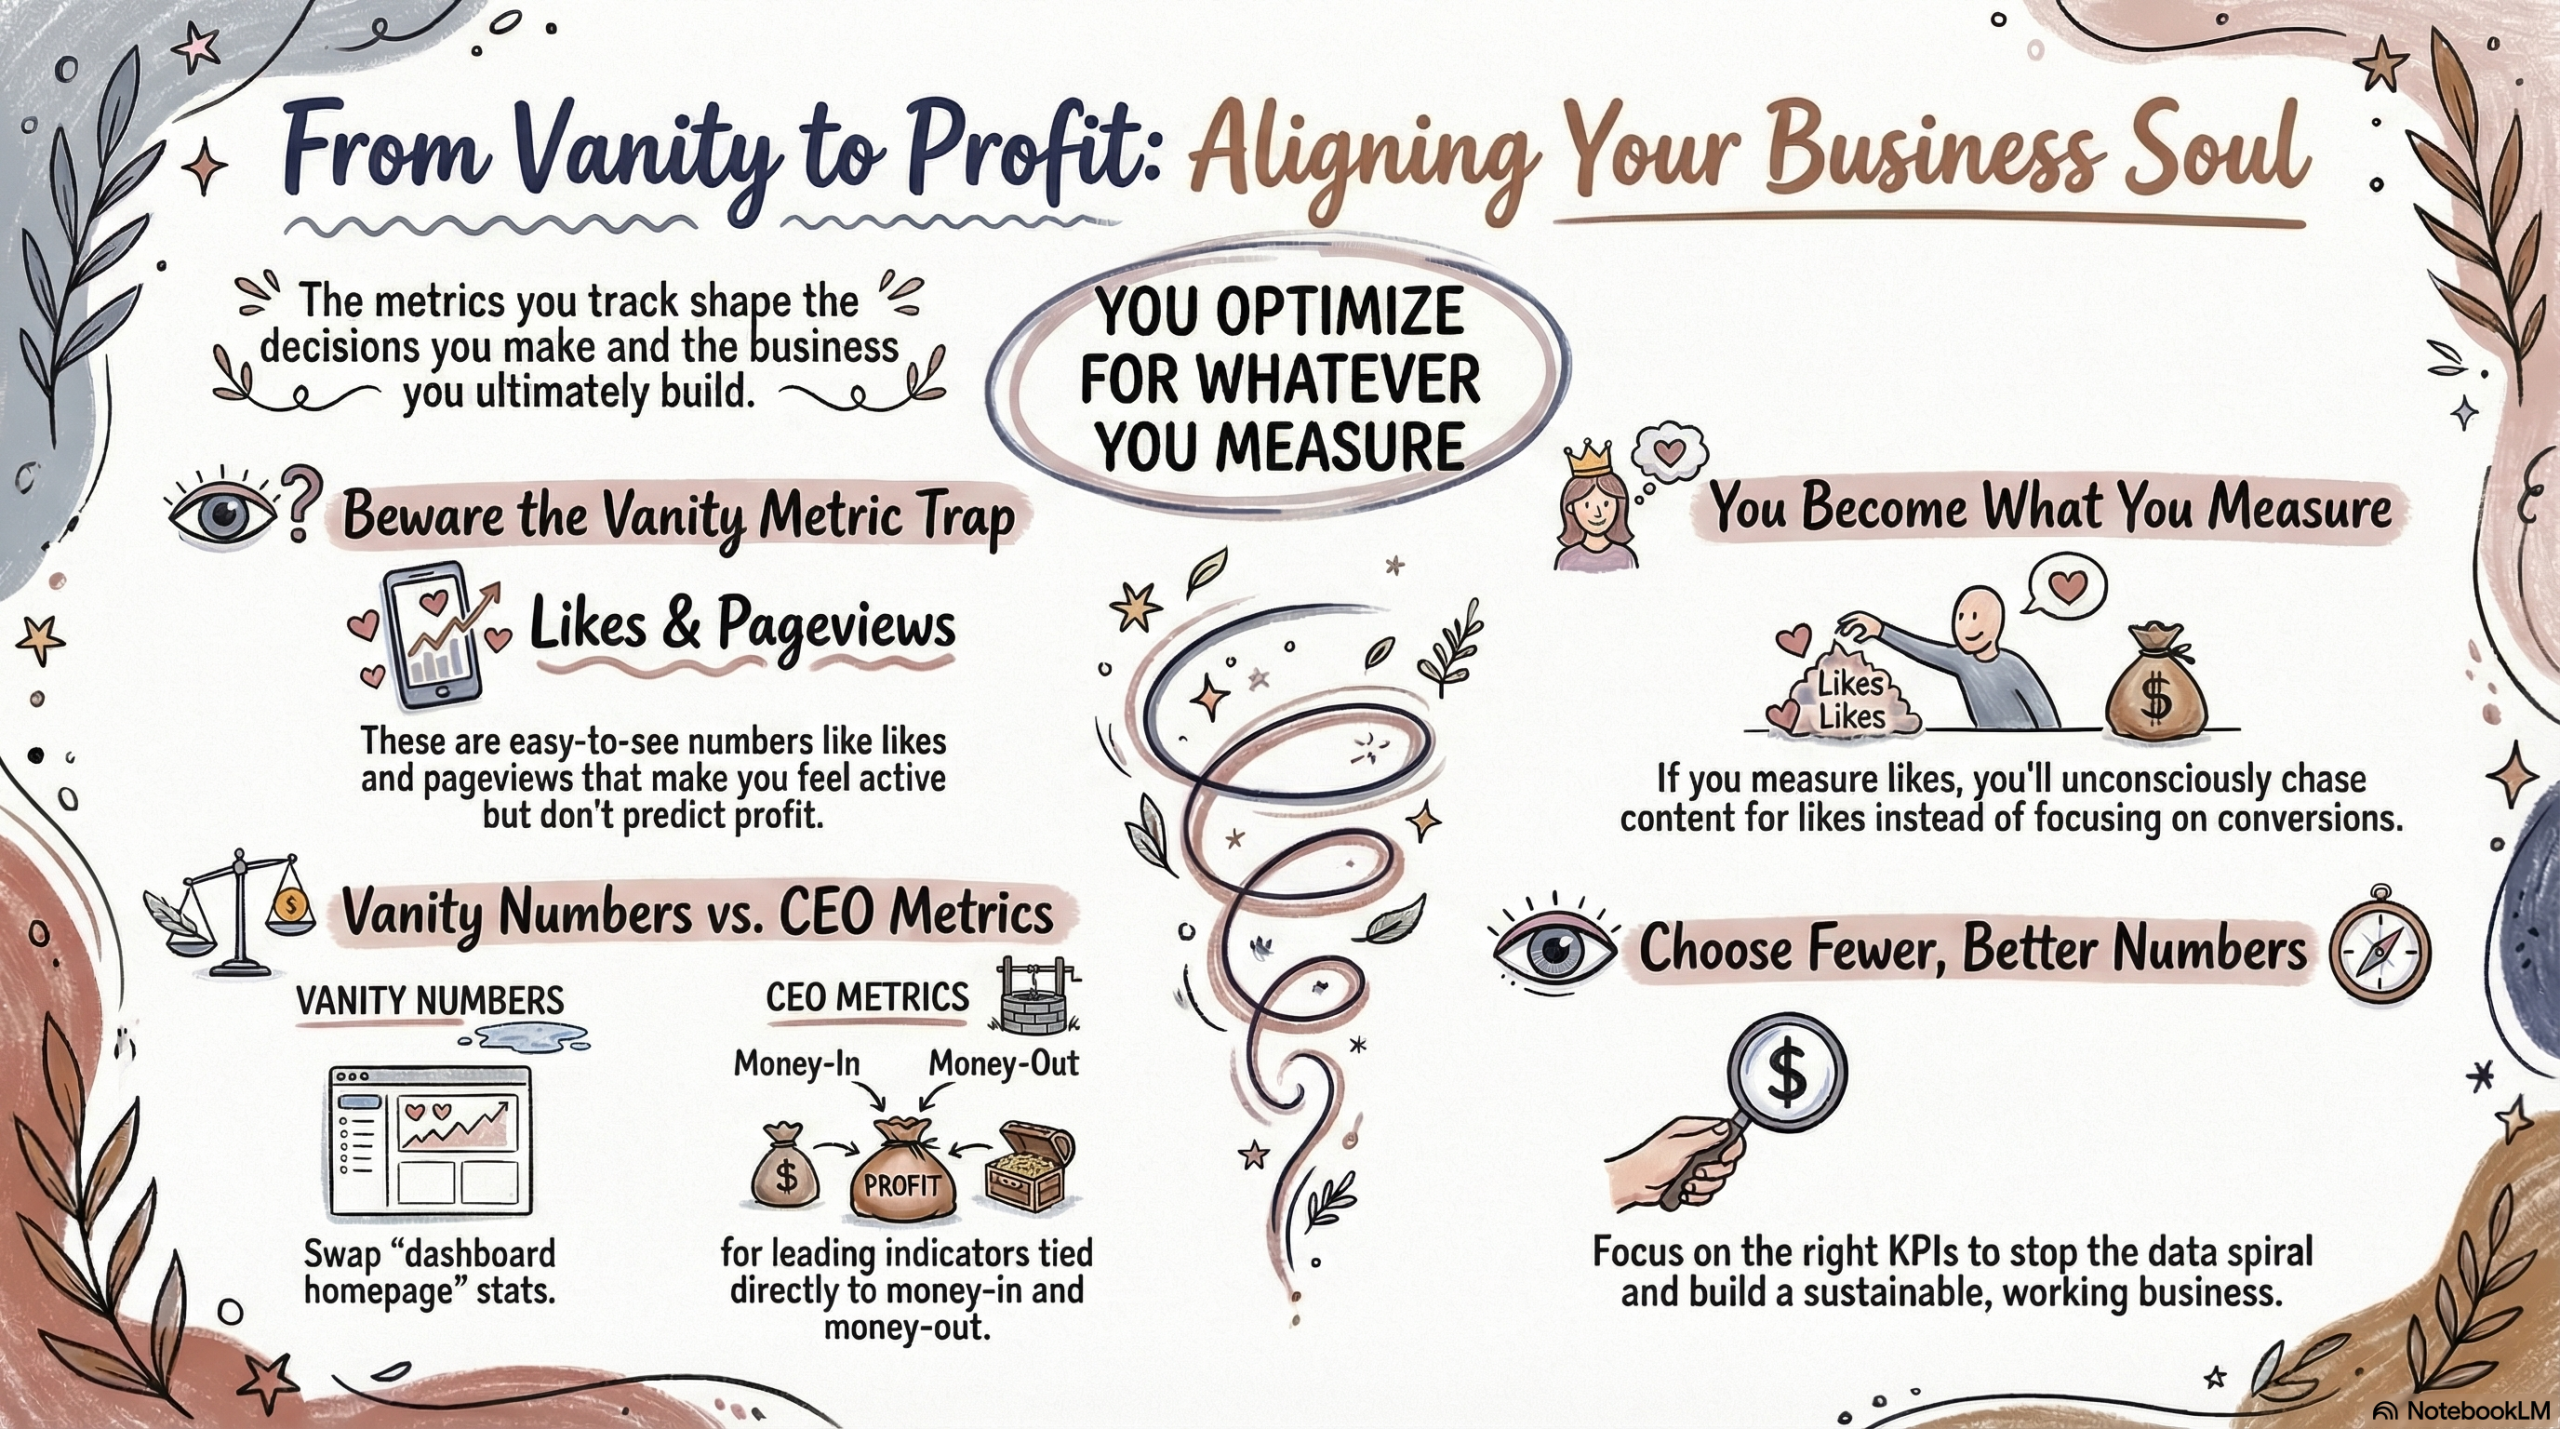
Vanity metrics are numbers that make your business look or feel active but don’t directly predict revenue, profit, or sustainable growth. CEO metrics — also called leading indicators or profit-forward KPIs (key performance indicators, the specific numbers you use to measure business health) — are directly tied to money in, money out, and the levers that drive both.
The real cost of misaligned metrics is this: you optimize for whatever you measure. If you’re measuring likes, you’ll unconsciously start chasing content that generates likes. If you’re measuring pageviews, you’ll write for traffic instead of conversion. The metrics you track shape the decisions you make, which shapes the business you build.
I know this from personal experience — and not in the inspirational way. I have OCD. I have spiraled over a spreadsheet or twelve. When I was tracking the wrong numbers, I wasn’t just wasting time; I was making real decisions based on data that had nothing to do with whether my business was actually working.
Fewer numbers, the right numbers, fixed that faster than any productivity system I’ve ever tried.
The Exact Weekly Business Metrics I Track as a CEO
My weekly CEO dashboard has exactly five numbers. Not twenty. Not a color-coded tracking system with seventeen tabs (I’ve built those — they’re beautiful and useless). Five numbers, reviewed in fifteen minutes, once a week.
Here’s each one and why it made the cut.
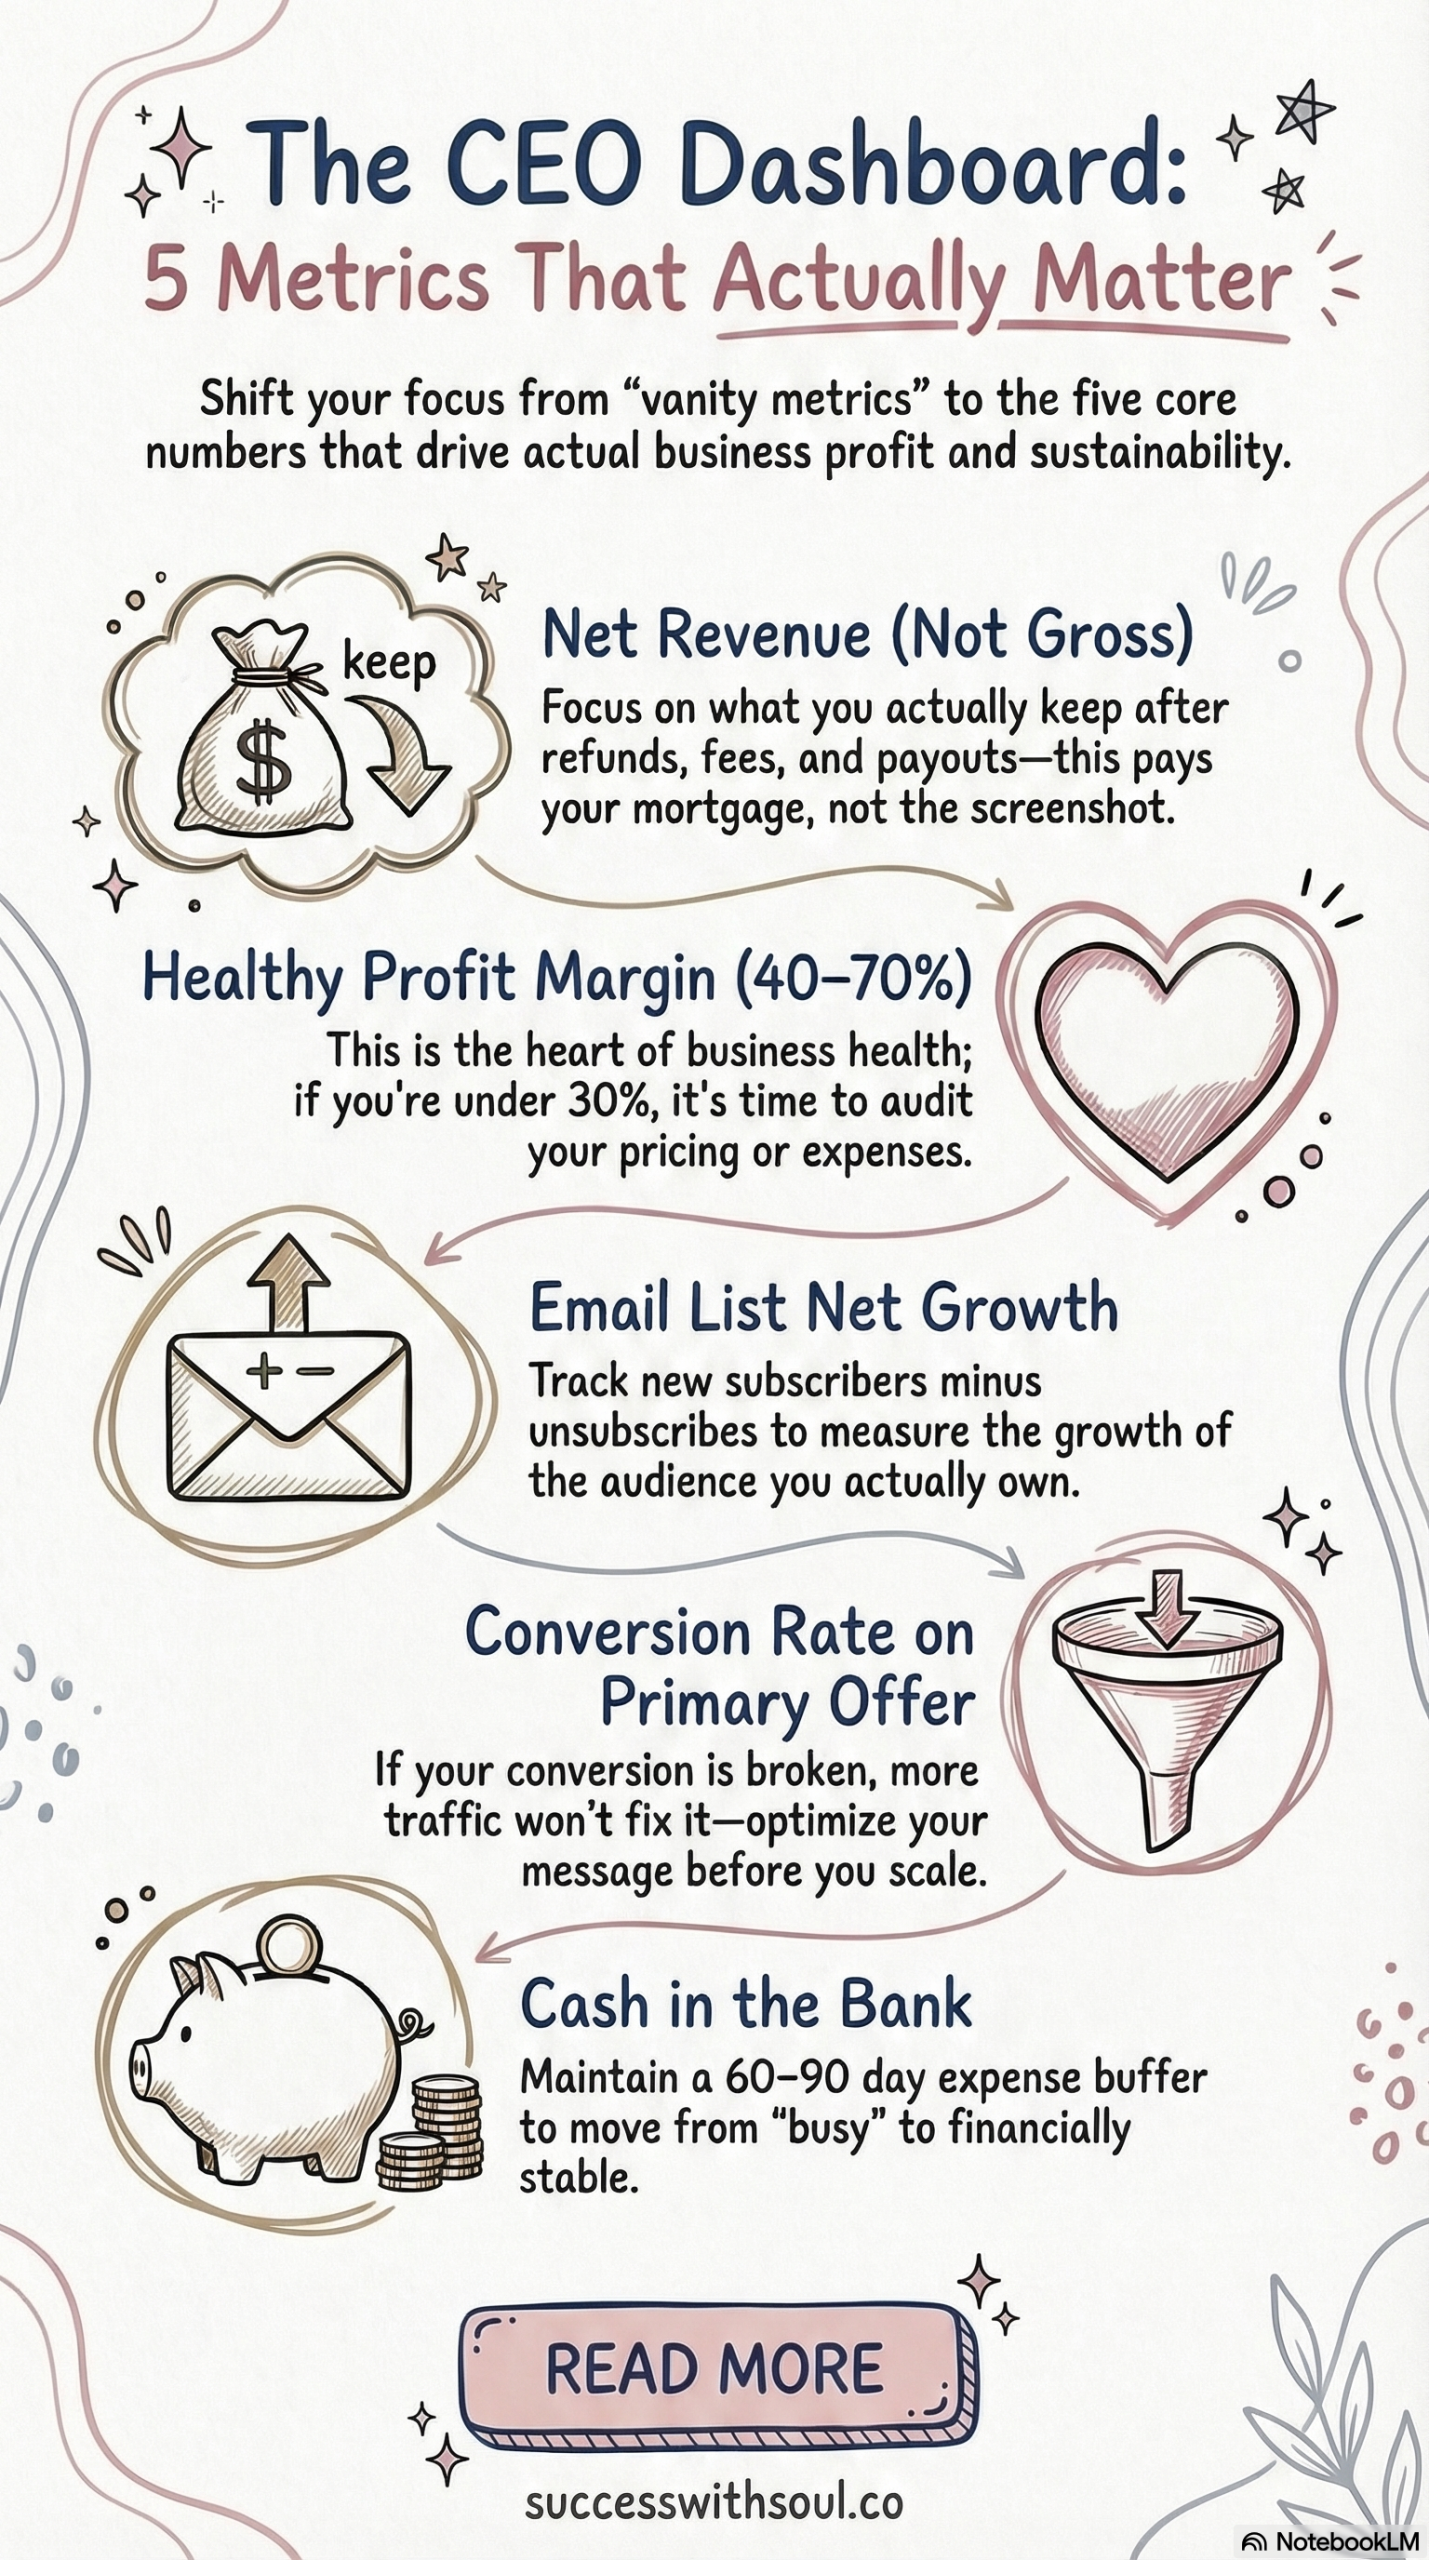
1. Net Revenue (Not Gross — Net)
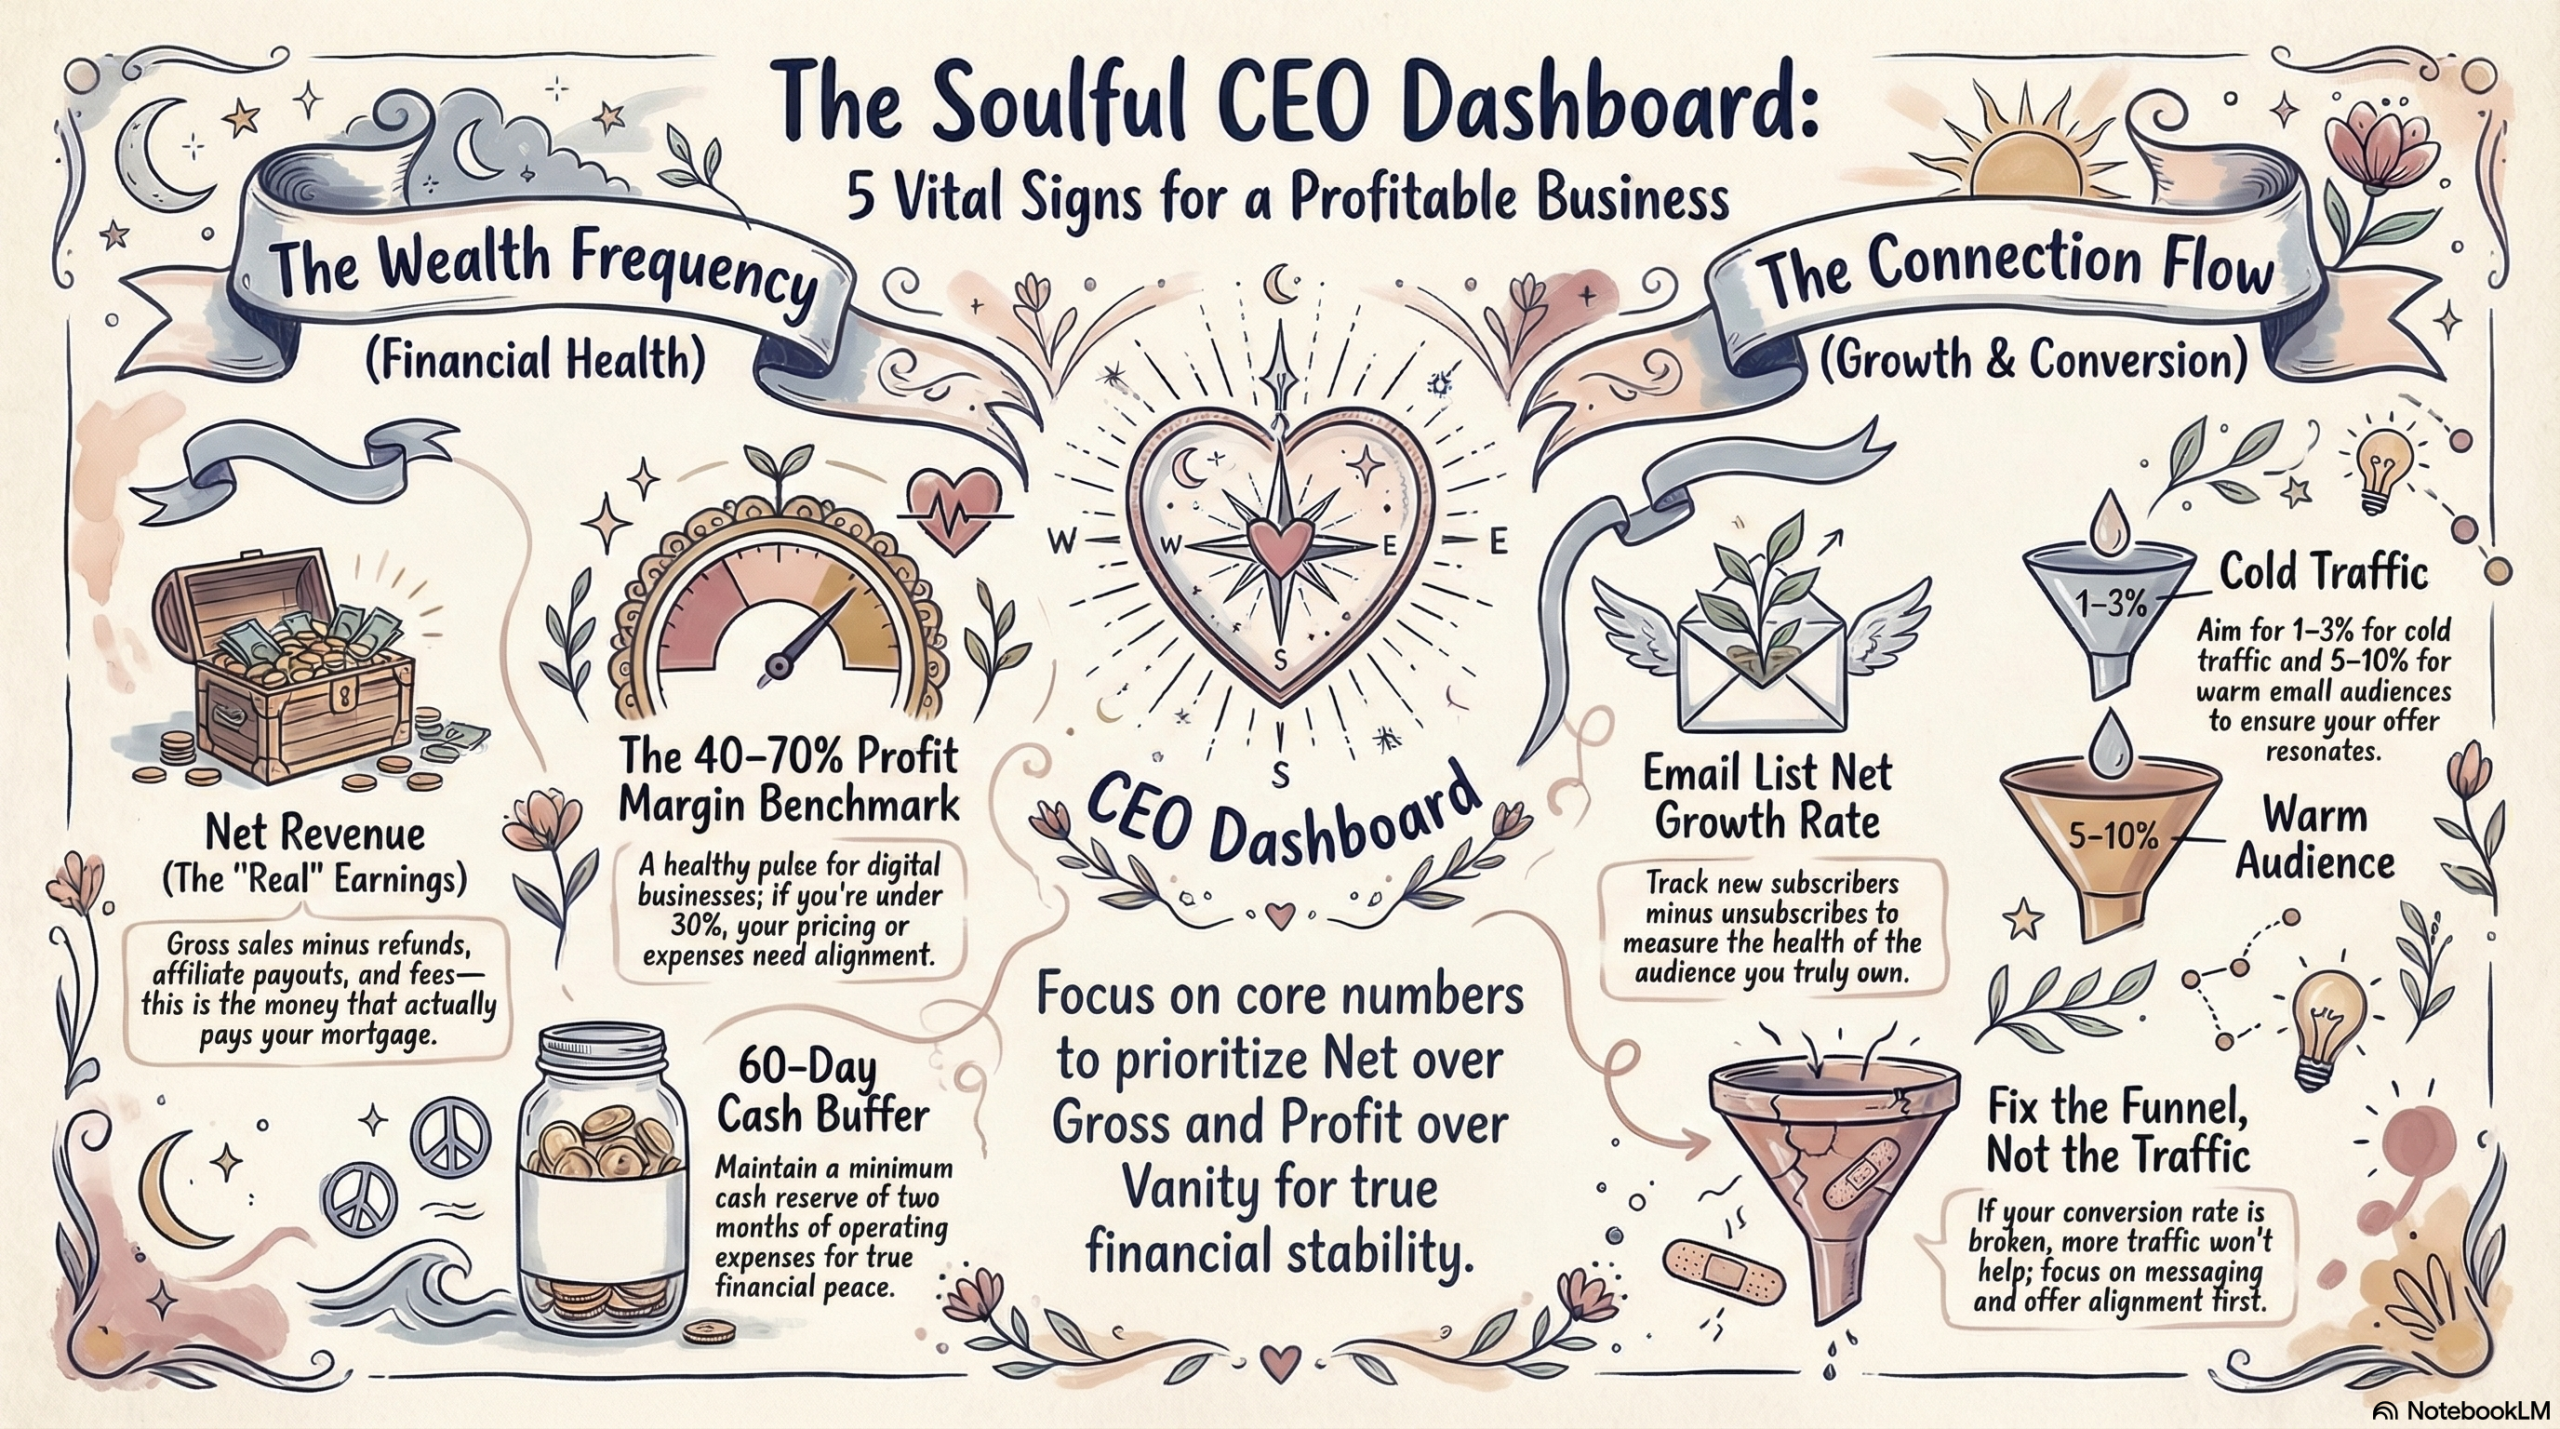
Net revenue — gross sales minus refunds, affiliate payouts, and payment processing fees — is the only revenue number that tells you what you actually earned. Gross revenue is what looks great in a screenshot. Net revenue is what pays your mortgage.
This distinction matters more than most people realize. If you sold $10,000 in a month but had $1,200 in refunds, $800 in affiliate commissions to pay out, and $400 in Stripe fees, your net revenue is $7,600. That’s a $2,400 difference… which changes your profit margin calculation entirely.
I track this weekly inside The $1K/Day Experiment — my behind-the-scenes membership where I document the real numbers of running a business toward $1,000/day in net revenue. (More on that later.)
How to find it: Your payment processor — Stripe, ThriveCart, Kajabi, or PayPal — should have a net revenue report that accounts for fees. For affiliate payouts, check your affiliate platform (I use Kartra’s built-in affiliate manager) and subtract manually if needed.
2. Profit Margin
Profit margin is the percentage of net revenue left after all business expenses — and for most online businesses, it’s the most important number no one talks about.
The formula: (Net Revenue − Total Expenses) ÷ Net Revenue × 100 = Profit Margin %.
A healthy profit margin for a solo or small-team online business is 40–70%. Service businesses (coaching, consulting, done-for-you services) often run 60–80%. Digital product and course businesses can exceed 70% once systems and automation are in place.
If you’re under 30%, something is off — either your pricing is too low or your expenses are too high.
This is the heart of running a profit-first business — a framework popularized by Mike Michalowicz in his book Profit First, which argues that profitability shouldn’t be what’s left after expenses but what you design for first. I’ve used a modified version of this framework since 2022, and it changed how I price every offer I create.
Revenue is vanity. Profit is the actual point.
How to track it: Pull your net revenue (above) and your total monthly business expenses from your bookkeeping software — I use QuickBooks Online — and run the calculation. Weekly, I do a quick estimate. Monthly, I reconcile exactly.
3. Email List Net Growth Rate
Email list net growth rate — new subscribers added minus unsubscribes and bounces, expressed as a weekly number — tells you whether your primary owned audience is growing or shrinking. Raw subscriber count doesn’t tell you this. You need the net number.
This matters for one fundamental reason: you own your email list. A platform algorithm change, an account ban, or a social media company deciding to tank organic reach (which, as someone who quit all social platforms in 2021, I watched happen to colleagues in real time) cannot take your list from you.
Email marketing generates approximately $36–42 in revenue per $1 spent, according to the Data & Marketing Association’s 2024 benchmarks — a return rate that no social platform comes close to matching.
I track net list growth weekly because it helps me catch funnel leaks early. If I have a week where new subscribers are high but net growth is flat, that tells me something is off with my welcome sequence or my lead magnet quality and I can investigate before the problem compounds.
How to track it: Your email platform — ConvertKit (now Kit), Flodesk, ActiveCampaign, or MailerLite — should show new subscribers and unsubscribes separately. Subtract to get net. Track in a simple Google Sheet with a weekly column.
4. Conversion Rate on Your Primary Offer
Conversion rate is the percentage of people who see or click your offer and actually buy it — and it’s the most under-tracked metric in online business. Most entrepreneurs have no idea what their conversion rate is. They just know they want more sales, so they create more content and hope something sticks.
Here’s the problem with that approach: if your conversion rate is broken, more traffic doesn’t fix it. It just sends more people to a broken funnel.
Benchmarks to know: Sales page conversion rates for digital products typically range from 1–3% for cold traffic and 5–10% for warm (email list) traffic. Webinar-to-offer conversions average 10–20% for highly qualified audiences.
If you’re below these benchmarks, the issue is your messaging, your offer, or your audience fit… not the volume of traffic.
I track the conversion rate on my primary evergreen offer weekly. A small improvement here creates disproportionate revenue impact. Going from 2% to 3% on a funnel getting 500 clicks per week means five more sales weekly with zero additional traffic.
How to track it: Divide number of purchases by number of unique clicks (or unique page views) on your sales page. Multiply by 100. Most payment platforms — ThriveCart, Kartra, Kajabi, Teachable — show this in their analytics dashboards.
5. Cash in the Bank (The Unsexy One)
Cash on hand — the literal balance in your business checking account — is the most unglamorous metric and one of the most important. If you can’t cover next month’s expenses from current cash reserves, you have a cash flow problem, not a marketing problem.
This isn’t a complicated KPI. It’s not a ratio or a percentage. It’s a number you can see in your bank app. But most entrepreneurs I talk to don’t check it regularly — they check it when something feels off, which is usually too late to adjust proactively.
I maintain a minimum cash buffer of two months of operating expenses in my business account at all times, following the guidance of bookkeeper and financial educator Melissa Houston (CFO of her firm, Cash Flow CFO), whose framework suggests that for solo online businesses, a 60–90 day expense buffer is the baseline for financial stability.
Checking this weekly keeps me honest about whether my revenue is actually building the financial cushion I think it is or whether I’m spending in pace with my earning and running on a very profitable-looking treadmill.
What I Track Inside The $1K/Day Experiment

The $1K/Day Experiment is my ongoing behind-the-scenes membership where I document what it actually looks like to run a business toward $1,000/day in net revenue. The diaries, the dashboards, the weekly debriefs, the months where the numbers don’t cooperate and what I do about it.
Every week inside the Experiment, I share my real numbers: net revenue, profit margin, list growth, and what I’m testing. Members get the dashboard template I use (built in Google Sheets — free, functional, no complicated tech required), the weekly debrief format, and access to every past diary entry.
The whole premise of the Experiment is transparency over performance. Not “here’s my best month ever” content. Actual data, actual thinking, actual course-correcting in real time.
If you want to see exactly how I run my CEO metrics review — the format, the questions I ask, the decisions it drives — The $1K/Day Experiment is where that lives.
The Vanity Metrics I’ve Officially Quit Tracking
Here’s the part I genuinely enjoy writing. These are the metrics I used to track that I have permanently removed from my life. No shade to anyone who still tracks them — but for me, these were expensive distractions.
Social media followers. I quit all social platforms in 2021. My business grew 165% the following year. The follower count I was so anxious about protecting turned out to be protecting nothing. When you’re not on social media, this one takes care of itself.
Total website pageviews. Traffic without conversion context is a popularity contest, not a business metric. I replaced pageviews with conversion rate. Now I care less about how many people show up and more about what percentage of them do the thing I’m inviting them to do.
Email open rates as a primary KPI. Apple Mail Privacy Protection, rolled out in iOS 15 (September 2021) and expanded since, inflates open rates by pre-loading tracking pixels for every email — regardless of whether the recipient actually opens it. According to Litmus’s 2024 Email Analytics Report, Apple Mail now accounts for over 58% of email opens tracked, most of which are artificially inflated. Open rates are now a directional signal at best. I track click rate instead.
Launch buzz. DMs that say “so excited about this!” Reply-to-my-email enthusiasm. The general electricity of a launch week. None of it converts one-to-one to sales, and I spent years mistaking it for a leading indicator of revenue. It’s not.
Hours worked. More hours is not more money. For most of my business’s life, I’ve worked 20 hours per week or fewer. The idea that grinding harder is a metric of anything except how tired you are is one of the most insidious myths in entrepreneurship — and it disproportionately affects women and parents who have actual lives to run alongside their businesses.
How to Build Your Own Weekly Metrics Ritual (In Under 20 Minutes)
A weekly CEO metrics ritual doesn’t require a complicated analytics stack. It requires five numbers, a Google Sheet, and a standing appointment with yourself.
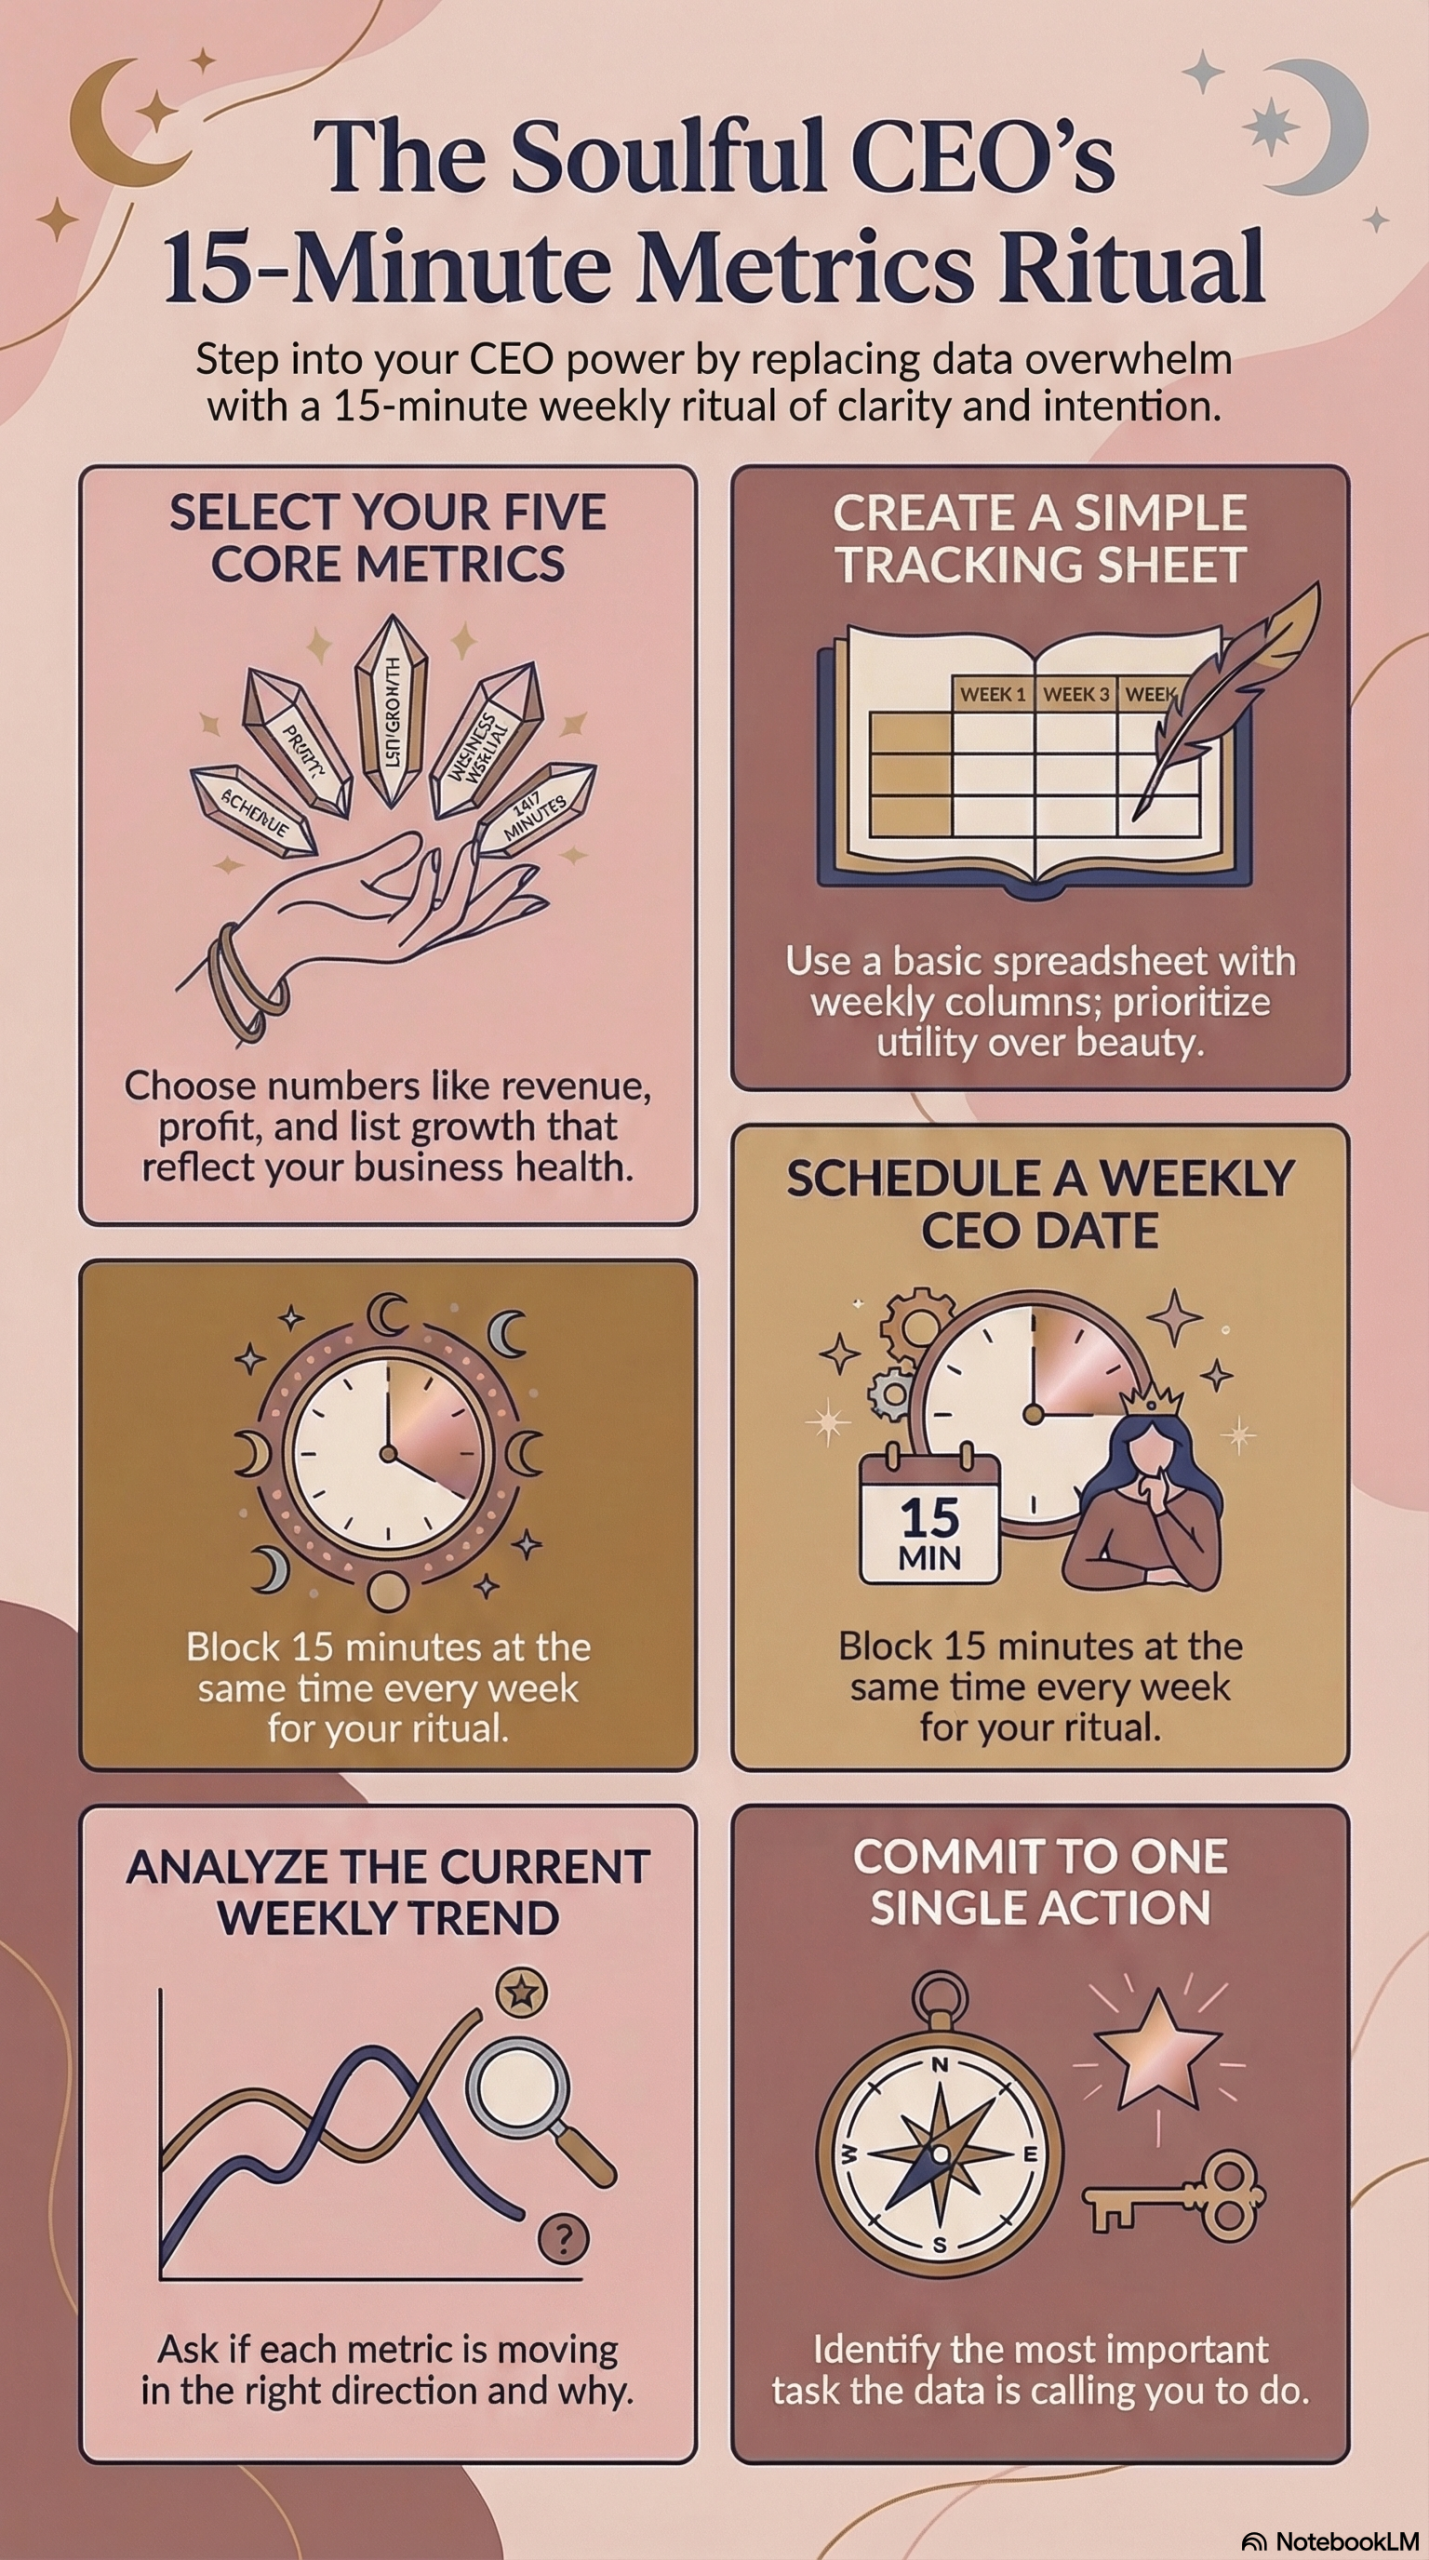
Step 1: Pick your five numbers.
Start with the list above: net revenue, profit margin, email list net growth, conversion rate on your primary offer, and cash on hand. Modify based on your business model — a service-based business might swap conversion rate for new client inquiries.
Step 2: Build one simple tracking doc.
A Google Sheet with columns for each week and rows for each metric is genuinely sufficient. I’ve used this format for three years. Resist the urge to make it beautiful before you make it useful.
Step 3: Schedule a 15-minute weekly CEO date.
Same day, same time, every week. Mine is Friday mornings with decaf coffee and, ideally, no children asking me where things are. Block it in your calendar like a client call — because it is one.
Step 4: Ask one question per metric.
“Is this trending in the right direction this week? Why or why not?”
You don’t need to solve everything in 15 minutes. You need to know where to look.
Step 5: Choose one action.
Not five. One. The most important thing the data is telling you to do this week. That’s it. That’s the whole practice.
The goal isn’t more data. It’s better decisions, faster… made by a CEO who knows exactly where she stands.
FAQ: Business Metrics, Vanity Metrics, and What to Track Weekly
What’s the difference between vanity metrics and CEO metrics for online businesses?
Vanity metrics — like social media followers, total pageviews, or gross revenue — make a business look or feel active but don’t directly predict profit or sustainability. CEO metrics are the specific numbers tied to financial outcomes: net revenue, profit margin, email list net growth rate, and conversion rate on your primary offer. Vanity metrics optimize for visibility; CEO metrics optimize for viability.
How often should I check my business metrics?
Track net revenue, profit margin, email list growth, and cash on hand weekly. Review conversion rates weekly with deeper analysis monthly. Avoid daily metric-checking — one day’s data doesn’t have enough signal to act on, and the anxiety it creates costs more than the insight it provides. Monthly, do a deeper review comparing current numbers to the prior month and year-over-year.
What’s a healthy profit margin for an online business?
A healthy profit margin for a solo or small-team online business is 40–70%. Coaching and service businesses typically run 60–80% margins. Digital product and course businesses can exceed 70% once fulfillment is automated and team costs are low. If your margin is under 30%, audit your pricing and your recurring expenses — one of them is usually the culprit.
Do I need expensive software to track these metrics?
No. A Google Sheet, your email platform’s native dashboard (ConvertKit/Kit, Flodesk, ActiveCampaign), and your payment processor (Stripe, ThriveCart, Kajabi) provide everything you need. QuickBooks Online or Wave (free) handles profit margin calculations. The tool doesn’t matter — the habit does.
Why is email list growth more important than social media follower growth?
You own your email list. No algorithm change, account suspension, or platform shutdown can take it from you. Email subscribers also convert to buyers at significantly higher rates — typically 5–10% for warm audiences, compared to less than 1% conversion from social media organic reach, per HubSpot’s 2024 State of Marketing Report. Your email list is a business asset. Your follower count is rented real estate.
The Bottom Line on Business Metrics
Fewer numbers. The right numbers. A fifteen-minute weekly habit.
That’s the whole system. You don’t need more data. You need clearer data — and the discipline to stop measuring the things that feel good to measure when they don’t actually tell you anything useful.
You’re not behind. You might just have been running a race tracked by the wrong stopwatch.
If you want to see exactly how I run my weekly CEO review — the Google Sheets dashboard, the debrief format, and the real numbers from my own business — it’s all inside The $1K/Day Experiment. No fluff, no performance, just the actual data and what I do with it.
What’s one metric you’re currently tracking that you suspect might be a vanity metric? Drop it in the comments — I’m curious what we’re all ready to quit.


")


FEELING OVERWHELMED?
There’s only one way to eat an elephant (hint: one bite at a time!) and our 30-step roadmap to starting an online business will help you check things off your to do list like a pro!
YES, PLEASE!

